EveryBeam OSKAR SKA integration tests
Not to put a dampener on WODEN, but if you’re using the the OSKAR primary beam, I would just use OSKAR to make visibilities. Sure, WODEN does precession, which OSKAR doesn’t, but OSKAR has a fully GPU version of the beam which is so much faster. The EveryBeam OSKAR implementation takes a large, large amount of time to run.
These tests are all setup and explained in test_MWA.ipynb. We’ll look a the beam shape, test Stokes recovery, and make an image from visibilities.
Goes without saying, but these tests rely on everybeam being installed.
import sys
##This is to get hold of EveryBeam on my machine
sys.path.append('/home/jline/software/installed/lib/python3.12/site-packages')
import os
from subprocess import call
from astropy.io import fits
import numpy as np
from astropy.table import Column, Table
from astropy.time import Time
from astropy.coordinates import SkyCoord
from astropy.coordinates import EarthLocation
from astropy import units as u
import matplotlib.pyplot as plt
import numpy.testing as npt
from astropy.constants import c
from astropy.wcs import WCS
import everybeam as eb
from wodenpy.primary_beam.use_everybeam import load_MWA_telescope, load_OSKAR_telescope, load_LOFAR_telescope, run_everybeam, radec_to_xyz, run_everybeam_over_threads
import erfa
import mwa_hyperbeam
from wodenpy.skymodel.read_fits_skymodel import calc_everybeam_for_components
from wodenpy.use_libwoden.create_woden_struct_classes import Woden_Struct_Classes
from ctypes import c_double
from astropy.time import TimeDelta
from wodenpy.array_layout.precession import RTS_Precess_LST_Lat_to_J2000
from wodenpy.array_layout.create_array_layout import convert_ecef_to_enh

import sys
sys.path.append('../../scripts/')
from run_woden import main as run_woden

##A bunch of test and plotting code lives here so we can use it in multile notebooks
from eb_testing_code import create_WCS, plot_jones_on_sky, plot_everybeam_on_sky, make_sky_models, read_uvfits, convert_inst_to_stokes, test_stokes_recovery, getFDF, findpeaks, test_RM_recovery, make_RM_skymodel

os.environ["MWA_BEAM_FILE"] = "/home/jline/software/MWA_beam_files/mwa_full_embedded_element_pattern.h5"

C = c.to('m/s').value

from casacore.tables import table
First up just quickly, let’s see what station layout I’m using
MWA_LAT=-26.703319405555554
MWA_LONG=116.67081523611111

with table('create_OSKAR-SKA_ms/OSKAR-SKA-layout.ms' + '/ANTENNA') as t:

            num_ants = len(t)
            ant_locations = np.array([t.getcell('POSITION', ant) for ant in range(num_ants)])
            ##convert from ECEF to ENH, as WODEN starts with enh coords
            east, north, height = convert_ecef_to_enh(ant_locations[:,0],
                                        ant_locations[:,1], ant_locations[:,2],
                                        np.radians(MWA_LONG),
                                        np.radians(MWA_LAT))

east /= 1000
north /= 1000

fig, axs = plt.subplots(1, 3, figsize=(15, 5), layout='constrained')

for ax in axs:
    ax.plot(east, north, 'o',mfc='none', ms=2)

edge = 6
x_cent = 9.3
y_cent = -13.5

axs[1].set_xlim(x_cent-edge, x_cent+edge)
axs[1].set_ylim(y_cent-edge, y_cent+edge)

edge = 1.5
axs[2].set_xlim(x_cent-edge, x_cent+edge)
axs[2].set_ylim(y_cent-edge, y_cent+edge)

for ax in axs:
    ax.set_xlabel('East (km)')
    ax.set_aspect('equal', 'box')
axs[0].set_ylabel('North (km)')
plt.show()
Successful readonly open of default-locked table create_OSKAR-SKA_ms/OSKAR-SKA-layout.ms/ANTENNA: 8 columns, 512 rows
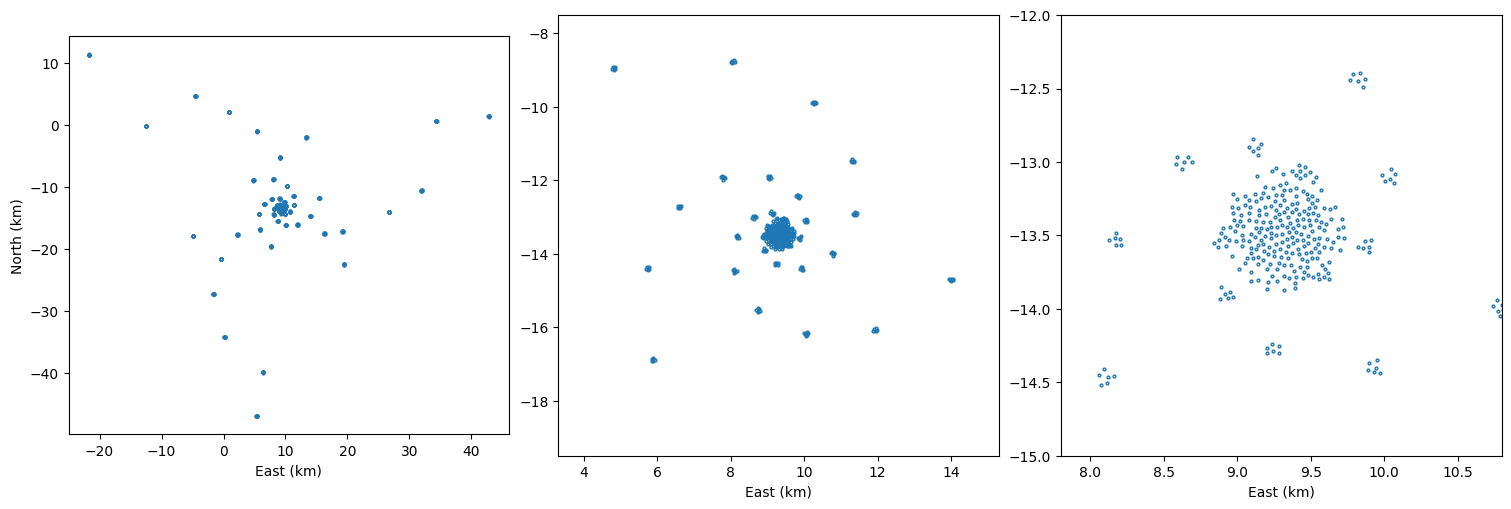
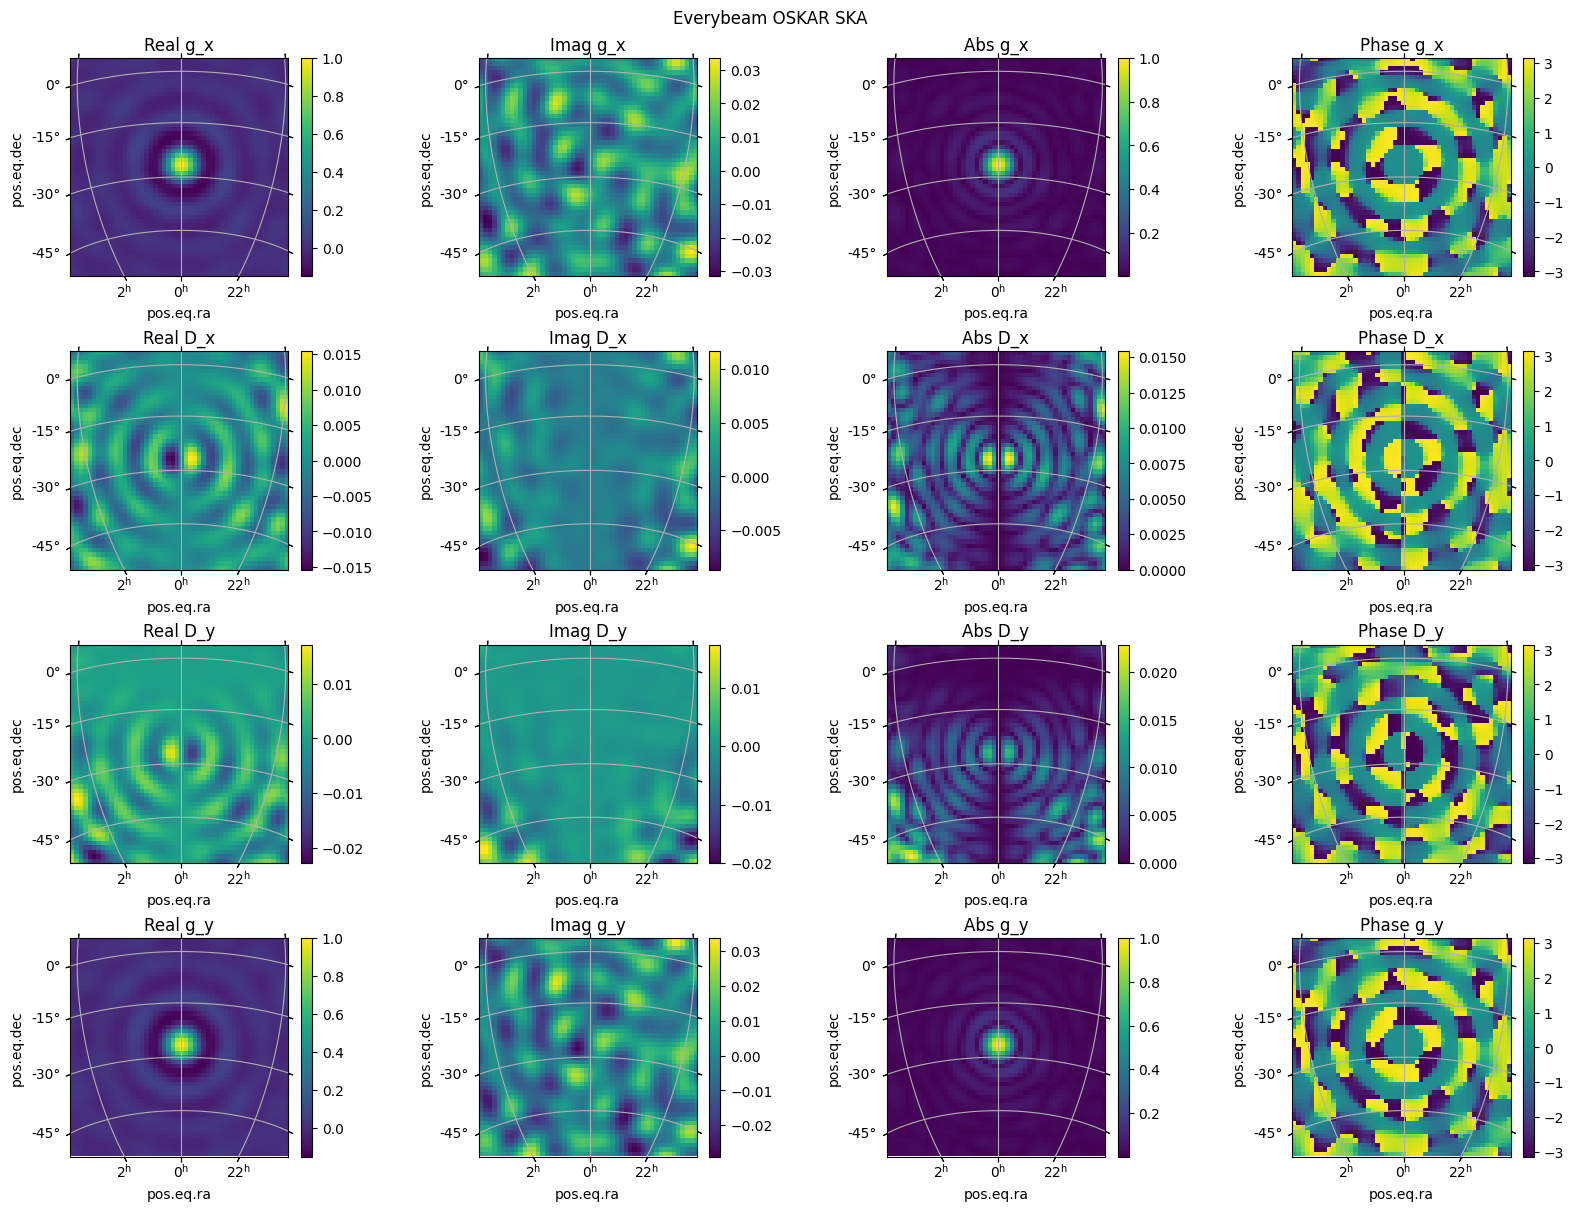
Image the beam on the sky
First up, let’s see if we can just plot an OSKAR SKA station beam to check it looks sensible.
##pick a time/date that sticks our phase centre overhead
date = "2024-07-21T20:13:00"
##Assume that the OSKAR telescope is near the MWA??
mwa_location = EarthLocation(lat=MWA_LAT*u.deg,
                            lon=MWA_LONG*u.deg,
                            height=377.827)
observing_time = Time(date, scale='utc', location=mwa_location)

##Grab the LST
LST = observing_time.sidereal_time('mean')
LST_deg = LST.value*15
print(f"LST: {LST_deg} deg")
LST: 0.0045520088542088475 deg
ms_path="create_OSKAR-SKA_ms/OSKAR-SKA-layout.ms"

ra0 = LST_deg
dec0 = MWA_LAT

mjd_current = observing_time.mjd
lst_J2000, latitude_J2000 = RTS_Precess_LST_Lat_to_J2000(np.radians(LST_deg),
                                                         np.radians(MWA_LAT),
                                                         mjd_current)

nside=50
radec_reso=60/nside

header, wcs = create_WCS(ra0, dec0, nside, radec_reso)
x_mesh, y_mesh = np.meshgrid(np.arange(nside), np.arange(nside))
ras, decs = wcs.all_pix2world(x_mesh, y_mesh, 0)

ras = np.radians(ras.flatten())
decs = np.radians(decs.flatten())

freq = 100e+6

coeff_path=""
station_id = 0
station_ids = [0]
j2000_latitudes = [latitude_J2000]
j2000_lsts = [lst_J2000]
times = [observing_time]
freqs = [freq]
current_latitude = np.radians(MWA_LAT)
current_longitude = np.radians(MWA_LONG)

apply_beam_norms=True
use_differential_beam=False

##We need to turn on parallactic rotation in wodenpy as it doesn't exist for
##EveryBeam MWA. We also need to reorder the jones to get north-south first
parallactic_rotate=False
reorder_jones=False
eb_rotate = True

element_response = "skala40_wave"

##How many cores to split the work over
num_threads=8

# telescope = load_OSKAR_telescope(ms_path)

all_jones = run_everybeam_over_threads(num_threads, ms_path,
                            coeff_path,
                            ras, decs,
                            np.radians(ra0), np.radians(dec0),
                            j2000_latitudes, j2000_lsts,
                            current_latitude, current_longitude,
                            times, freqs, station_ids,
                            use_differential_beam=use_differential_beam,
                            apply_beam_norms=apply_beam_norms,
                            reorder_jones=reorder_jones,
                            parallactic_rotate=parallactic_rotate,
                            element_response_model=element_response,
                            eb_rotate=eb_rotate)

beam_ind, time_ind, freq_ind = 0, 0, 0

all_gx_eb = all_jones[beam_ind, time_ind, freq_ind, :, 0, 0]
all_Dx_eb = all_jones[beam_ind, time_ind, freq_ind, :, 0, 1]
all_Dy_eb = all_jones[beam_ind, time_ind, freq_ind, :, 1, 0]
all_gy_eb = all_jones[beam_ind, time_ind, freq_ind, :, 1, 1]

all_gx_eb.shape = (nside, nside)
all_Dx_eb.shape = (nside, nside)
all_Dy_eb.shape = (nside, nside)
all_gy_eb.shape = (nside, nside)

plot_jones_on_sky(all_gx_eb, all_Dx_eb, all_Dy_eb, all_gy_eb, wcs, 'Everybeam OSKAR SKA')
Thread 5 processing coords 1565 to 1878
Thread 2 processing coords 626 to 939Thread 4 processing coords 1252 to 1565

Thread 1 processing coords 313 to 626Thread 6 processing coords 1878 to 2191

Thread 3 processing coords 939 to 1252
Thread 0 processing coords 0 to 313
Thread 7 processing coords 2191 to 2504
Could not load dataset for frequency 100 MHz, using the nearest neighbor with frequency 110 MHz instead
Could not load dataset for frequency 100 MHz, using the nearest neighbor with frequency 110 MHz instead
Could not load dataset for frequency 100 MHz, using the nearest neighbor with frequency 110 MHz instead
Could not load dataset for frequency Could not load dataset for frequency 100 MHz, using the nearest neighbor with frequency 110 MHz instead
100 MHz, using the nearest neighbor with frequency 110 MHz instead
Thread 5 finished
Thread 3 finishedThread 2 finished

Thread 7 finished
Thread 6 finished
Thread 1 finished
Thread 0 finished
Thread 4 finished
Stokes recovery
Now try to recover single point source of either Stokes I, Q, U or V.
make_sky_models(ra0, dec0)

freq_reso = 1e+6
# low_freq = 180e+6
# high_freq = 210e+6
low_freq = 100e+6
high_freq = 150e+6


num_freq_chans = int((high_freq - low_freq) / freq_reso)

primary_beam = "everybeam_OSKAR"

for pol in ['I', 'Q', 'U', 'V']:
# for pol in ['I']:

    uvfits_name = f"stokes{pol}_{primary_beam}"
    cat_name = f'{pol}_source.fits'

    ##The command to run WODEN
    command = f'run_woden.py --ra0={ra0} --dec0={dec0} '
    command += f'--latitude={MWA_LAT} --longitude={long} '
    command += f'--date={date} --output_uvfits_prepend={uvfits_name} '
    command += f'--cat_filename={cat_name} --primary_beam={primary_beam} '
    command += f'--lowest_channel_freq={low_freq} --freq_res={freq_reso} '
    command += f'--num_freq_channels={num_freq_chans} --band_nums=1 '
    command += f'--time_res=2 --num_time_steps=1 --IAU_order '
    command += f' --station_id=0 '
    command += f'--beam_ms_path=create_OSKAR-SKA_ms/OSKAR-SKA-layout.ms '
    command += f'--num_threads=1 '

    call(command, shell=True)
Note I’ve deleted the outputs of the cell above, because EveryBeam spits out a bunch of error messages with the OSKAR beam warning about frequencies mismatching, and not having a central direction set. The outputs seems fine. It’s a TODO to silence these warnings.
for pol in ['I', 'Q', 'U', 'V']:
    uvfits_name = f"stokes{pol}_everybeam_OSKAR"
    XX, XY, YX, YY = read_uvfits(f'{uvfits_name}_band01.uvfits')
    ##pick a random baseline to plot, they should all be the sam
    baseline = 0

    recover_I, recover_Q, recover_U, recover_V = convert_inst_to_stokes(XX[baseline], XY[baseline], YX[baseline], YY[baseline])

    print(f"Input {pol}, Recover I {recover_I[0].real:.2f}, Q {recover_Q[0].real:.2f}, U {recover_U[0].real:.2f}, V {recover_V[0].real:.2f}")
    # print(f"Input {pol}, Recover I {recover_I[-1].real:.2f}, Q {recover_Q[-1].real:.2f}, U {recover_U[-1].real:.2f}, V {recover_V[-1].real:.2f}")

    test_stokes_recovery(pol, 'everybeam_OSKAR', atol=9e-2)
Input I, Recover I 1.00, Q 0.00, U 0.00, V -0.00
Testing Stokes I
Stokes I passed
Input Q, Recover I 0.00, Q 1.00, U 0.00, V -0.00
Testing Stokes Q
Stokes Q passed
Input U, Recover I 0.00, Q -0.00, U 1.00, V 0.00
Testing Stokes U
Stokes U passed
Input V, Recover I -0.00, Q 0.00, U 0.00, V 1.00
Testing Stokes V
Stokes V passed
We get back what we put in so all is well.
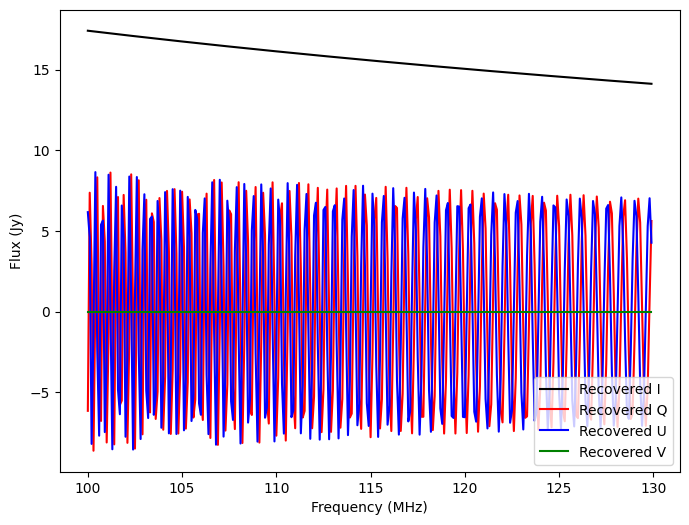
RM recovery
phi_RM, pol_frac = make_RM_skymodel(ra0, dec0)

freq_reso = 0.1e+6
low_freq = 100e+6
high_freq = 130e+6
num_freq_chans = int((high_freq - low_freq) / freq_reso)


primary_beam = "everybeam_OSKAR"

uvfits_name = f"rm_source_{primary_beam}"
cat_name = 'RM_source.fits'

##The command to run WODEN
command = f'run_woden.py --ra0={ra0} --dec0={dec0} '
command += f'--date={date} --output_uvfits_prepend={uvfits_name} '
command += f'--latitude={MWA_LAT} --longitude={long} '
command += f'--cat_filename={cat_name} --primary_beam={primary_beam} '
command += f'--lowest_channel_freq={low_freq} --freq_res={freq_reso} '
command += f'--num_freq_channels={num_freq_chans} --band_nums=1 '
command += f'--time_res=2 --num_time_steps=1 --IAU_order '
command += f' --station_id=0 '
command += f'--beam_ms_path=create_OSKAR-SKA_ms/OSKAR-SKA-layout.ms '
command += f'--num_threads=1 '

call(command, shell=True)
Note I’ve deleted the outputs of the cell above, because EveryBeam spits out a bunch of error messages with the OSKAR beam warning about frequencies mismatching, and not having a central direction set. The outputs seems fine. It’s a TODO to silence these warnings.
XX, XY, YX, YY = read_uvfits('rm_source_everybeam_OSKAR_band01.uvfits')
baseline = 0
recover_I, recover_Q, recover_U, recover_V = convert_inst_to_stokes(XX[baseline], XY[baseline], YX[baseline], YY[baseline])


freqs = np.arange(low_freq, high_freq, freq_reso)

fig, axs = plt.subplots(1, 1, figsize=(8, 6))

axs.plot(freqs / 1e+6, recover_I.real, 'k-', label='Recovered I')
axs.plot(freqs / 1e+6, recover_Q.real, 'r', label='Recovered Q')
axs.plot(freqs / 1e+6, recover_U.real, 'b', label='Recovered U')
axs.plot(freqs / 1e+6, recover_V.real, 'g', label='Recovered V')

axs.legend()

axs.set_xlabel('Frequency (MHz)')
axs.set_ylabel('Flux (Jy)')

plt.show()
test_RM_recovery(uvfits_name, phi_RM, pol_frac, freqs, atol=0.02)
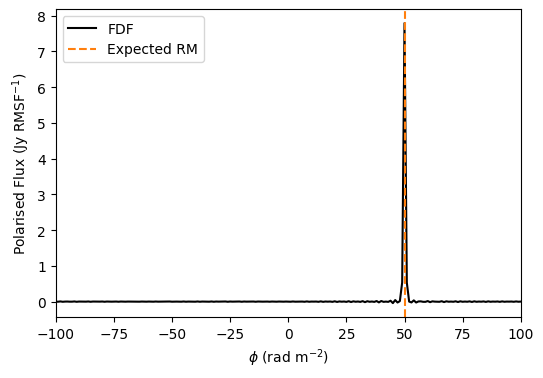
Recovered RM: 50.0 Expected RM: 50
Recovered Pol. Fraction: 0.5 Expected Pol Fraction 0.5
We recover the correct RM which is nice.
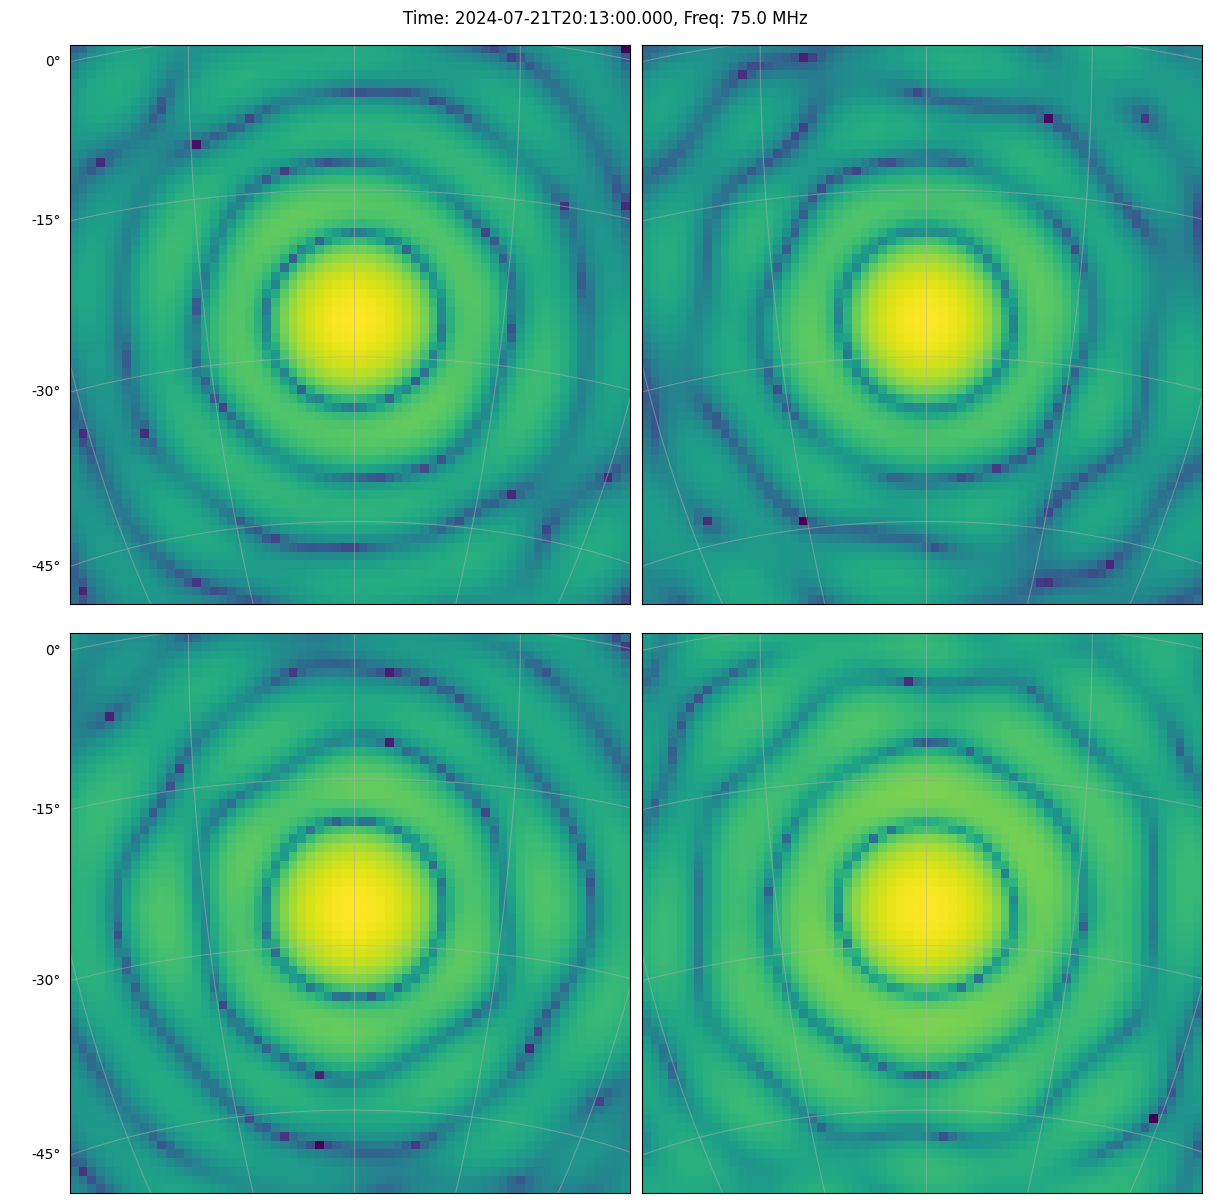
Test unique primary beam per station
Righto, we’ll just run the first four stations as the skala40_wave model is slow and I don’t have all day. Run it for two time steps, two freqs to check things change sensibly.
After we’ll run a full WODEN simulation with an off-zenith point source to check that all visibilities are unique.
##Setup a grid of RA/Dec on the sky
##Setup a grid of RA/Dec on the sky
nside=64
radec_reso = 50/nside

header, wcs = create_WCS(ra0, dec0, nside, radec_reso)
x_mesh, y_mesh = np.meshgrid(np.arange(nside), np.arange(nside))
ras, decs = wcs.all_pix2world(x_mesh, y_mesh, 0)

ras = np.radians(ras.flatten())
decs = np.radians(decs.flatten())

num_comps = len(ras)

all_freqs = np.array([75e+6, 200e+6])
all_times = np.array([observing_time, observing_time + TimeDelta(3*3600.0, format='sec')])
num_beams = 1
##Do the first four stations
station_ids = np.arange(4)

lsts = []
latitudes = []

for obs_time in all_times:

    LST = obs_time.sidereal_time('mean')
    lst_current = np.radians(LST.value*15)

    lst_J2000, latitude_J2000 = RTS_Precess_LST_Lat_to_J2000(
                                lst_current,
                                np.radians(MWA_LAT),
                                obs_time.mjd)

    lsts.append(lst_J2000)
    latitudes.append(latitude_J2000)

coeff_path=""
ms_path="create_OSKAR-SKA_ms/OSKAR-SKA-layout.ms"
use_differential_beam=False
apply_beam_norms = True
reorder_jones = False
parallactic_rotate = False
eb_rotate = True
element_response = "skala40_wave"

num_threads = 8

all_jones = run_everybeam_over_threads(num_threads, ms_path,
                            coeff_path,
                            ras, decs,
                            np.radians(ra0), np.radians(dec0),
                            latitudes, lsts,
                            np.radians(MWA_LAT), np.radians(MWA_LONG),
                            all_times, all_freqs, station_ids,
                            use_differential_beam=use_differential_beam,
                            apply_beam_norms=apply_beam_norms,
                            reorder_jones=reorder_jones,
                            parallactic_rotate=parallactic_rotate,
                            eb_rotate=eb_rotate,
                            element_response_model=element_response)
Thread 2 processing coords 1024 to 1536
Thread 0 processing coords 0 to 512
Thread 6 processing coords 3072 to 3584
Thread 1 processing coords 512 to 1024
Thread 4 processing coords 2048 to 2560
Thread 3 processing coords 1536 to 2048Thread 5 processing coords 2560 to 3072
Thread 7 processing coords 3584 to 4096

Could not load dataset for frequency 75 MHz, using the nearest neighbor with frequency 70 MHz instead
Could not load dataset for frequency 75 MHz, using the nearest neighbor with frequency 70 MHz instead
Could not load dataset for frequency 75 MHz, using the nearest neighbor with frequency 70 MHz instead
Could not load dataset for frequency 75 MHz, using the nearest neighbor with frequency 70 MHz instead
Could not load dataset for frequency Could not load dataset for frequency 75 MHz, using the nearest neighbor with frequency 70 MHz instead
Could not load dataset for frequency 75 MHz, using the nearest neighbor with frequency 70 MHz instead
75 MHz, using the nearest neighbor with frequency 70 MHz instead
Could not load dataset for frequency 75 MHz, using the nearest neighbor with frequency 70 MHz instead
Could not load dataset for frequency 200 MHz, using the nearest neighbor with frequency 230 MHz instead
Could not load dataset for frequency 200 MHz, using the nearest neighbor with frequency 230 MHz instead
Could not load dataset for frequency 200 MHz, using the nearest neighbor with frequency 230 MHz instead
Could not load dataset for frequency 200 MHz, using the nearest neighbor with frequency 230 MHz instead
Could not load dataset for frequency 200 MHz, using the nearest neighbor with frequency 230 MHz instead
Could not load dataset for frequency 200 MHz, using the nearest neighbor with frequency 230 MHz instead
Could not load dataset for frequency 200 MHz, using the nearest neighbor with frequency 230 MHz instead
Could not load dataset for frequency 200 MHz, using the nearest neighbor with frequency 230 MHz instead
Thread 0 finished
Thread 4 finished
Thread 3 finished
Thread 7 finished
Thread 1 finished
Thread 6 finished
Thread 5 finished
Thread 2 finished
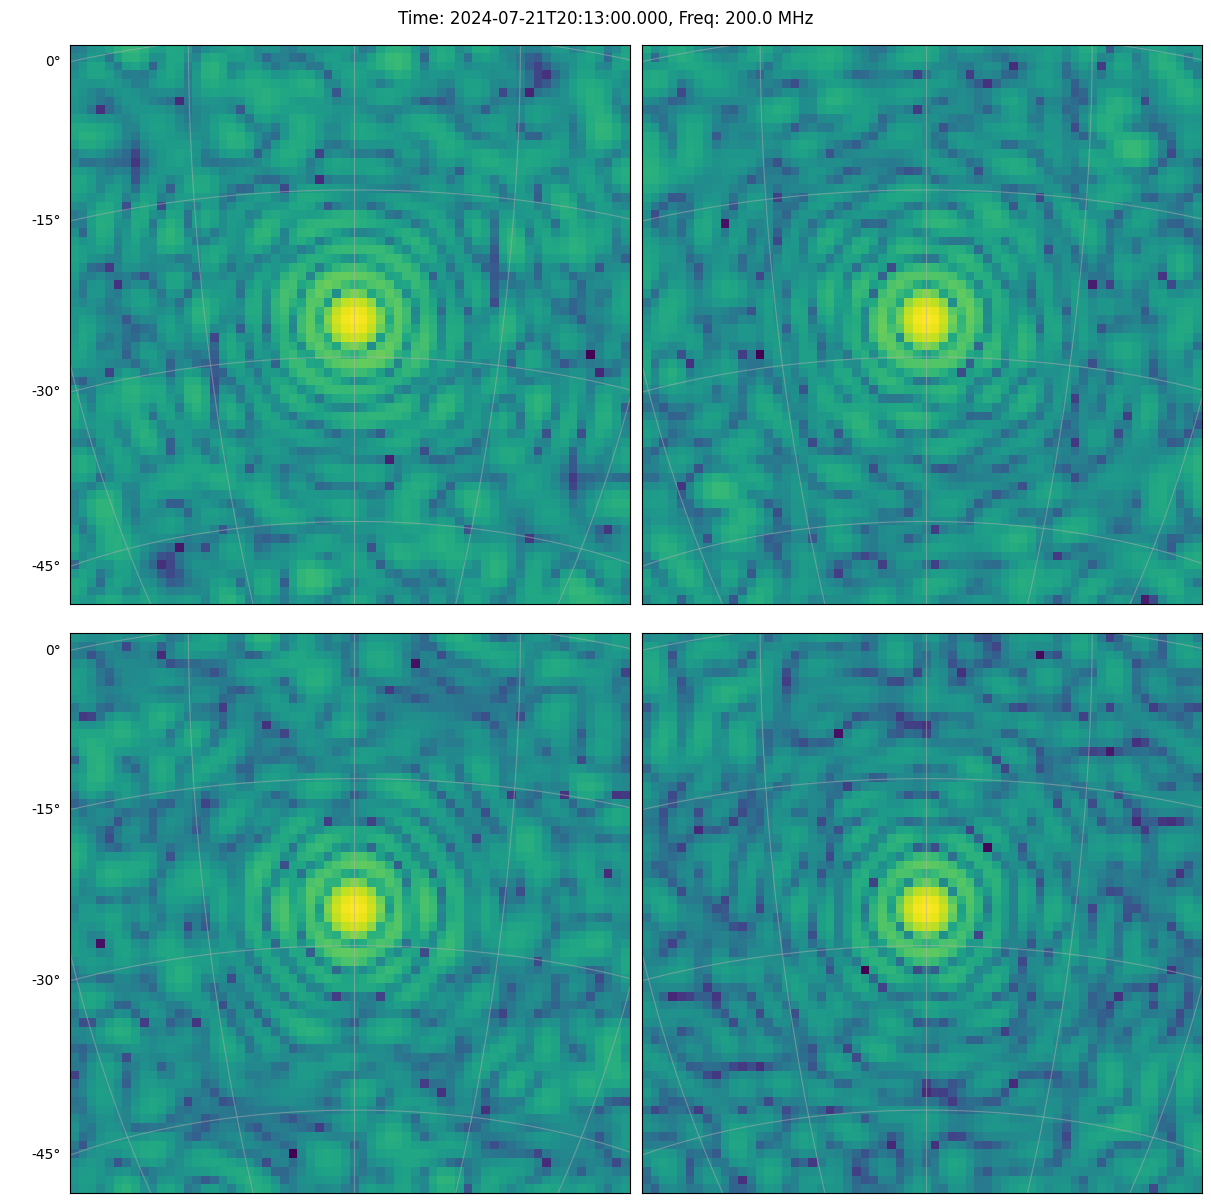
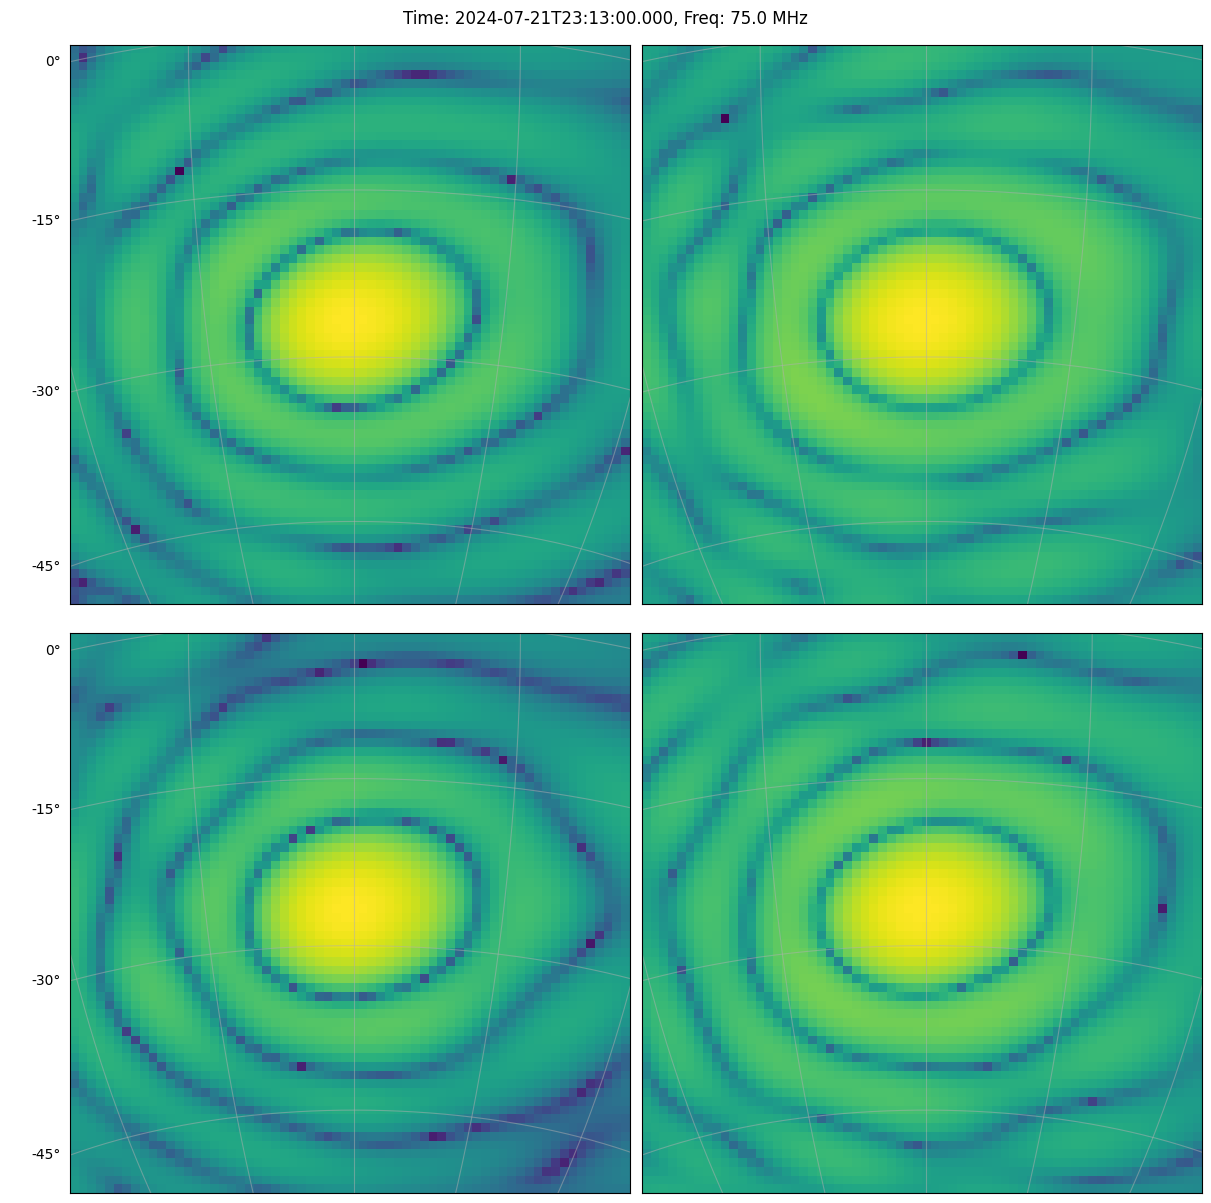
def plot_beam_selection(all_jones, time_ind, freq_ind, nside, wcs):
    fig, axs = plt.subplots(2, 2, figsize=(12, 12), layout='constrained',
                            subplot_kw={'projection': wcs})

    for col in range(2):
        for row in range(2):
            beam_ind = col*2 + row

            gx = all_jones[beam_ind, time_ind, freq_ind, :, 0,0]
            gx.shape = (nside, nside)

            im = axs[row, col].imshow(np.log10(np.abs(gx)), origin='lower')

            axs[row, col].grid(alpha=0.5)

            lon = axs[row, col].coords[0]
            lat = axs[row, col].coords[1]

            lon.set_ticks_visible(False)
            lat.set_ticks_visible(False)
            lon.set_axislabel(' ')
            lat.set_axislabel(' ')

            if col > 0:
                lat.set_ticklabel_visible(False)
            if row < 2:
                lon.set_ticklabel_visible(False)

            if col == 2:
                plt.colorbar(im, ax=axs[row, col], label='log10(abs(gx))')


    fig.suptitle(f"Time: {all_times[time_ind].isot}, Freq: {all_freqs[freq_ind]/1e+6} MHz")

    plt.show()

time_ind = 0
freq_ind = 0
plot_beam_selection(all_jones, time_ind, freq_ind, nside, wcs)
time_ind = 0
freq_ind = 1
plot_beam_selection(all_jones, time_ind, freq_ind, nside, wcs)
time_ind = 1
freq_ind = 0
plot_beam_selection(all_jones, time_ind, freq_ind, nside, wcs)
time_ind = 1
freq_ind = 1
plot_beam_selection(all_jones, time_ind, freq_ind, nside, wcs)
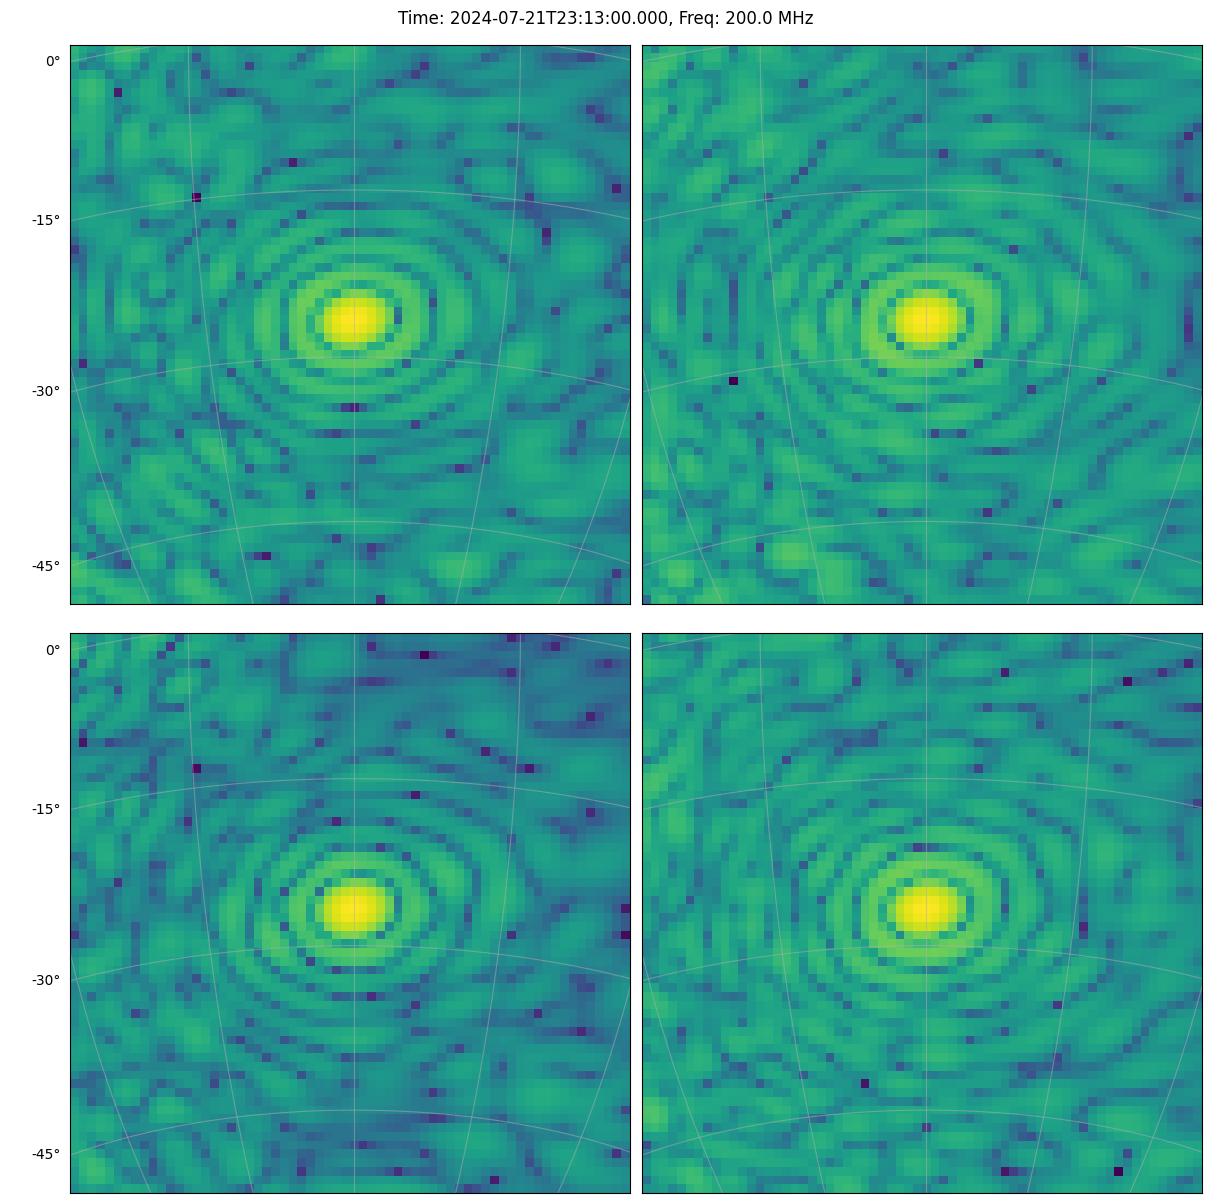
OK, so 3.6s to calculate the LOFAR Harmaker beam for a single station (but for the whole observation)
Let’s make an image
Just create a random sky image of some point sources for fun
ra_coord_hw = 15
dec_coord_hw = 10

num_coords = 500

ras = np.random.uniform(ra0 - ra_coord_hw, ra0 + ra_coord_hw, num_coords)
decs = np.random.uniform(dec0 - dec_coord_hw, dec0 + dec_coord_hw, num_coords)

ras[ras < 0] += 360

num_comps = len(ras)

c_ids = Column(data=np.array(['source']*num_comps), name='UNQ_SOURCE_ID', dtype='|S20')
c_names = Column(data=np.array([f'source_C{i:04d}' for i in range(num_comps)]), name='NAME', dtype='|S20')

##Component position
c_ras = Column(data=ras, name='RA')
c_decs = Column(data=decs, name='DEC')

##This says we have a point source
c_comp_types = Column(data=np.array(['P']*num_comps, dtype='|S1'), name="COMP_TYPE", dtype='|S1')
##This says we have a Stokes I power-law SED
c_mod_types = Column(data=np.array(['pl']*num_comps, dtype='|S3'), name="MOD_TYPE", dtype='|S3')

##Set everything as a flat spectrum 1 Jy stokes I source. That way we can image it and see the beam pattern
c_stokes_I_ref = Column(data=np.random.uniform(1, 10, num_comps), name='NORM_COMP_PL')
c_stokes_I_SI = Column(data=np.zeros(num_comps), name='ALPHA_PL')


cols = [c_ids, c_names, c_ras, c_decs, c_comp_types, c_mod_types, c_stokes_I_ref, c_stokes_I_SI]

main_table = Table(cols)

profile_cat = 'profiling_source.fits'

main_table.write(profile_cat, format='fits', overwrite=True)
cat_name = "profiling_source.fits"
low_freq = 50e+6
freq_reso = 100e+3
num_freq_chans = 1
uvfits_name = 'ska_image_test'
primary_beam = 'everybeam_OSKAR'

##The command to run WODEN
command = f'run_woden.py --ra0={ra0} --dec0={dec0} '
command += f'--latitude={MWA_LAT} --longitude={MWA_LONG} '
command += f'--date={date} --output_uvfits_prepend={uvfits_name} '
command += f'--cat_filename={cat_name} --primary_beam={primary_beam} '
command += f'--lowest_channel_freq={low_freq} --freq_res={freq_reso} '
command += f'--num_freq_channels={num_freq_chans} --band_nums=1 '
command += f'--time_res=2 --num_time_steps=2 --IAU_order '
# command += f' --station_id=0 '
command += f'--beam_ms_path=create_OSKAR-SKA_ms/OSKAR-SKA-layout.ms'

call(command, shell=True)
Note I’ve deleted the outputs of the cell above, because EveryBeam spits out a bunch of error messages with the OSKAR beam warning about frequencies mismatching, and not having a central direction set. The outputs seems fine. It’s a TODO to silence these warnings.
Also note that this simulation took 281 minutes on my desktop.
cmd = "woden_uv2ms.py "
cmd += "  --uvfits_prepend=ska_image_test_band "
cmd += "  --band_nums=1  "

call(cmd, shell=True)

cmd = "wsclean -name ska_image_test -size 4096 4096 -niter 2000 "
cmd += "  -auto-threshold 0.5 -auto-mask 3 "
cmd += "  -pol I -multiscale -weight briggs 0 -scale 0.005 -j 12 -mgain 0.85 "
cmd += "  -no-update-model-required "
cmd += "  ska_image_test_band*.ms "

##My installation of WSClean is borked, so I have to run this on command line
##Hence the print statement
print(cmd)
# call(cmd, shell=True)
/home/jline/software/anaconda3/envs/woden_dev/bin/woden_uv2ms.py:4: DeprecationWarning: pkg_resources is deprecated as an API. See https://setuptools.pypa.io/en/latest/pkg_resources.html
  __import__('pkg_resources').require('wodenpy==2.3.0')
rm: cannot remove 'ska_image_test_band01.ms': No such file or directory
The telescope frame is set to '????', which generally indicates ignorance. Defaulting the frame to 'itrs', but this may lead to other warnings or errors.
The uvw_array does not match the expected values given the antenna positions. The largest discrepancy is 4.737312489034252 meters. This is a fairly common situation but might indicate an error in the antenna positions, the uvws or the phasing.
The uvw_array does not match the expected values given the antenna positions. The largest discrepancy is 4.737312489034252 meters. This is a fairly common situation but might indicate an error in the antenna positions, the uvws or the phasing.
Writing in the MS file that the units of the data are uncalib, although some CASA process will ignore this and assume the units are all in Jy (or may not know how to handle data in these units).
wsclean -name ska_image_test -size 4096 4096 -niter 2000 -auto-threshold 0.5 -auto-mask 3 -pol I -multiscale -weight briggs 0 -scale 0.005 -j 12 -mgain 0.85 -no-update-model-required ska_image_test_band*.ms
with fits.open('ska_image_test-image.fits') as hdu:
    image = np.squeeze(hdu[0].data)
    wcs = WCS(hdu[0].header).celestial

fig, axs = plt.subplots(1, 1, figsize=(12, 8), subplot_kw={'projection': wcs})

im = axs.imshow(image, origin='lower', cmap='Blues_r', vmin=0, vmax=1.0)
plt.colorbar(im, ax=axs, label='Jy/beam')

half_width = 2000
mid = 2048

axs.set_xlim(mid-half_width, mid+half_width)
axs.set_ylim(mid-half_width, mid+half_width)

plt.show()
WARNING: FITSFixedWarning: 'datfix' made the change 'Set MJD-OBS to 60512.842373 from DATE-OBS'. [astropy.wcs.wcs]
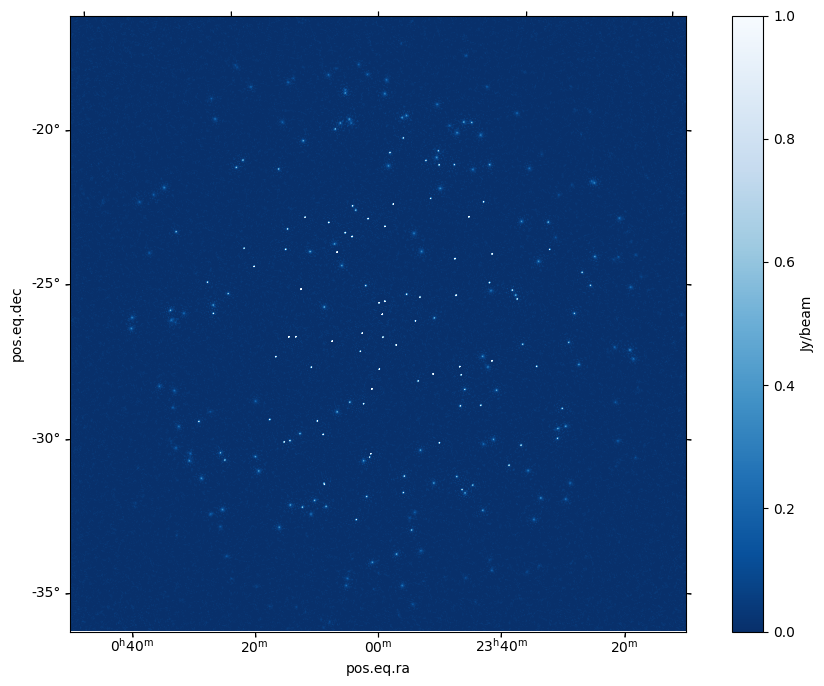
Pretty incredible image quality, given this is a single frequency channel, and only 2 time steps. We’ll overplot the source posisitons to show that the beam is properly down-weighting the sources at image edge.
fig, axs = plt.subplots(1, 1, figsize=(12, 8), subplot_kw={'projection': wcs})


im = axs.imshow(image, origin='lower', cmap='Blues_r', vmin=0, vmax=1.0)
plt.colorbar(im, ax=axs, label='Jy/beam')

x, y = wcs.all_world2pix(ras, decs, 0)
axs.scatter(x, y, s=2, c='C1', marker='x', alpha=0.3)

half_width = 2000
mid = 2048

axs.set_xlim(mid-half_width, mid+half_width)
axs.set_ylim(mid-half_width, mid+half_width)

plt.show()

Out of interest, what does the PSF look like?
with fits.open('ska_image_test-psf.fits') as hdu:
    image = np.squeeze(hdu[0].data)
    wcs = WCS(hdu[0].header).celestial

fig, axs = plt.subplots(1, 1, figsize=(12, 8), subplot_kw={'projection': wcs})

im = axs.imshow(image, origin='lower', cmap='Blues_r', vmin=0, vmax=1.0)
plt.colorbar(im, ax=axs, label='Jy/beam')

half_width = 100
mid = 2048

axs.set_xlim(mid-half_width, mid+half_width)
axs.set_ylim(mid-half_width, mid+half_width)

plt.show()
WARNING: FITSFixedWarning: 'datfix' made the change 'Set MJD-OBS to 0.000000 from DATE-OBS'. [astropy.wcs.wcs]
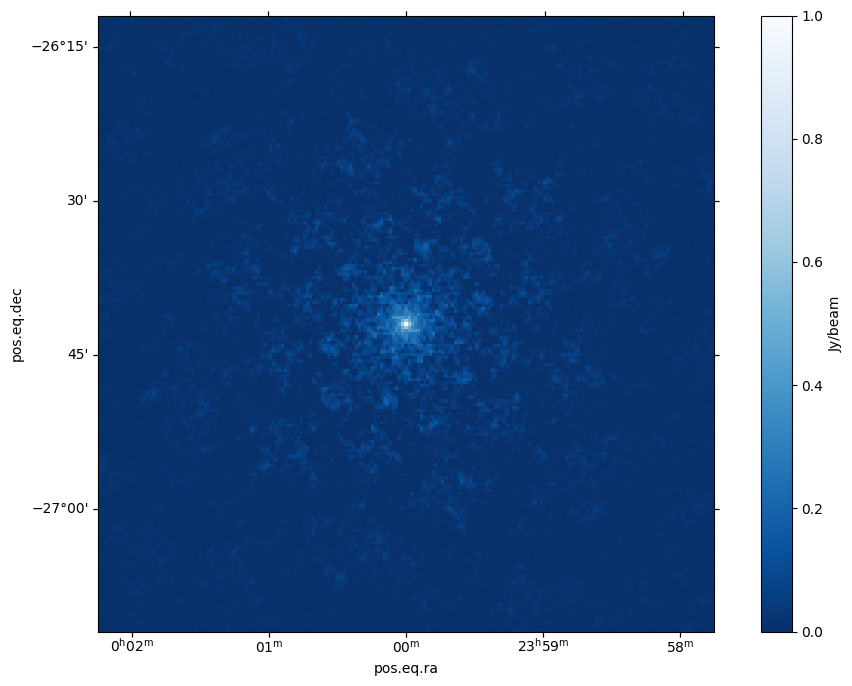
Like a snowflake, pretty cool.